Lorenz attractor using turtle
25 Jun 2014I recently discovered that a nice way to visualize the behavior of the Lorenz system is to use Python’s turtle module. In case you didn’t know, the Lorenz system is defined by the equations:
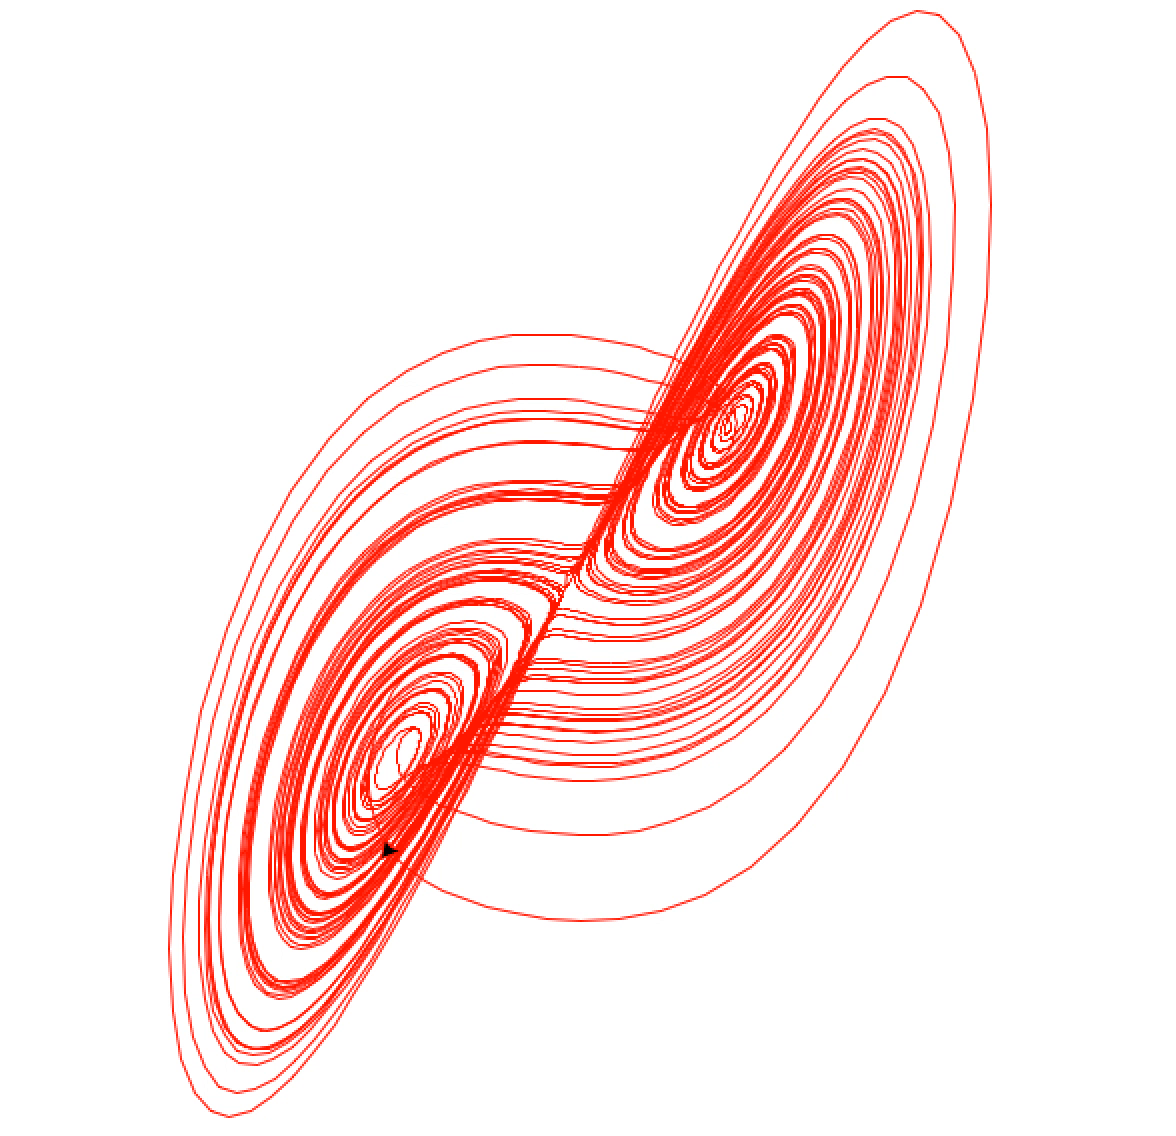
It’s interesting that such a simple system of differential equations can lead to such nontrivial results. Here’s what I came up with:
import turtle
from math import atan2

screen = turtle.Screen()
screen.title('Lorenz Attractor')

t = turtle.Turtle()
t.speed('fastest')
t.pensize(1)
t.pencolor('red')
t.radians()
t.pendown()

dt = 0.01
sigma = 10.0
beta = 2.667
rho = 28.0

x, y, z = 0.1, 1.0, 1.05
dx, dy, dz = 0.0, 0.0, 0.0
scale = 10

while True:
    t.setpos(x*scale, y*scale)
    t.setheading(atan2(dy, dx))

    dx = (sigma*(y - x)) * dt
    dy = (x*(rho - z) - y) * dt
    dz = (x*y - beta*z) * dt

    x += dx
    y += dy
    z += dz
Pretty self-explanatory I think, but its output is pretty cool:
Here is what gets produced after it runs for a while: